pyplot02
pyplot02
tr_eikon_eod_data 검색하여 데이터 사용
pyplot 2
예제 8_1
test1
1
2
3
4
5
6
7
8
9
10
11
12
13
14
15
16
17
18
19
20
21
22
23
24
25
26
27
28
29
30
31
32
33
34
35
36
37
38
39
40
41
42
43
44
45
import numpy as np
import pandas as pd
import matplotlib.pylab as plt
import matplotlib.colors as mcolors
import matplotlib.dates as dates
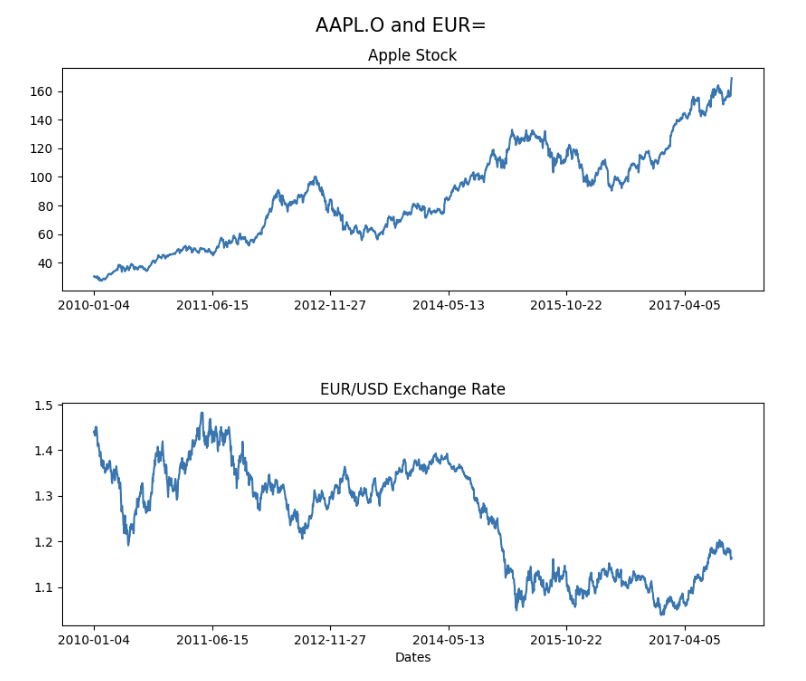
def finance1():
eikon_path = './tr_eikon_eod_data.csv'
dt_eikon = {
'Date':np.object_,
'AAPL.O':np.float64,
'MSFT.O':np.float64,
'INTC.O':np.float64,
'AMZN.O':np.float64,
'GS.N':np.float64,
'SPY':np.float64,
'.SPX':np.float64,
'.VIX':np.float64,
'EUR=':np.float64,
'XAU=':np.float64,
'GDX':np.float64,
'GLD':np.float64
}
df_eikon = pd.read_csv(eikon_path,dtype=dt_eikon)#,parse_dates=True)
#print(df_eikon.head(10))
#fig, (ax0, ax1) =
attributes = df_eikon.columns
fig,axes = plt.subplots(nrows=2,ncols=1,figsize=(10,8))
fig.suptitle("AAPL.O and EUR=",fontsize = 15, y=0.95)
fig.subplots_adjust(hspace=0.5)
# row 1 plot
axes[0].plot(attributes[0],attributes[1],data=df_eikon)
axes[0].set_title("Apple Stock")
axes[0].xaxis.set_major_locator(dates.YearLocator())
# row 2 plot
# axes[1]
axes[1].plot(attributes[0],attributes[9],data=df_eikon)
axes[1].set_title("EUR/USD Exchange Rate")
axes[1].xaxis.set_major_locator(dates.YearLocator())
axes[1].set_xlabel("Dates")
plt.show()
return None
test2
1
2
3
4
5
6
7
8
9
10
11
12
13
14
15
16
17
18
19
20
21
22
23
24
25
26
27
28
29
30
31
32
33
34
35
36
37
38
39
40
41
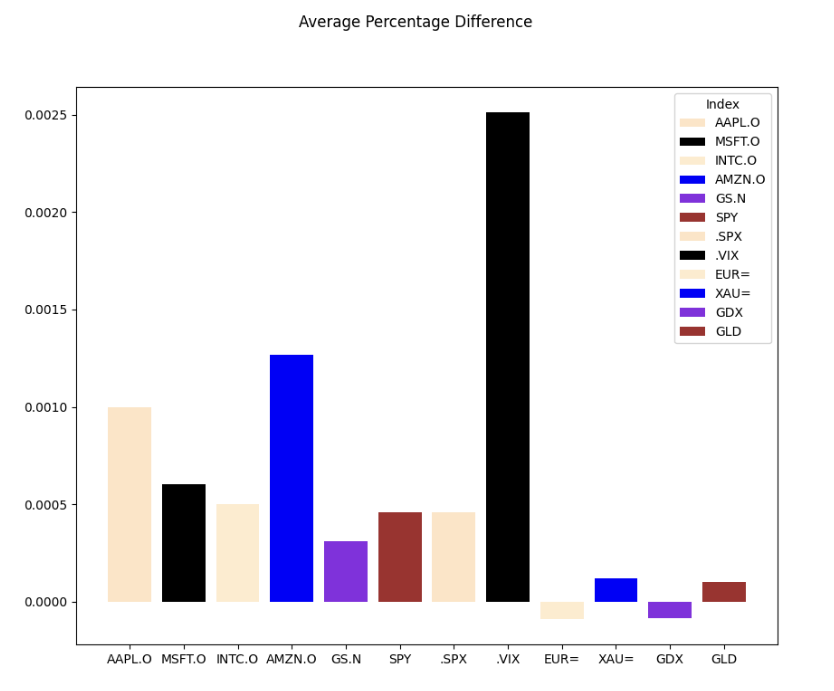
def finance2():
eikon_path = './tr_eikon_eod_data.csv'
dt_eikon = {
'Date':np.unicode_,
'AAPL.O':np.float64,
'MSFT.O':np.float64,
'INTC.O':np.float64,
'AMZN.O':np.float64,
'GS.N':np.float64,
'SPY':np.float64,
'.SPX':np.float64,
'.VIX':np.float64,
'EUR=':np.float64,
'XAU=':np.float64,
'GDX':np.float64,
'GLD':np.float64
}
df_eikon = pd.read_csv(eikon_path,dtype=dt_eikon,index_col=0)#,parse_dates=True)
df_abs_diff = df_eikon.diff() # absolute value의 difference
df_pct_diff = df_eikon.pct_change() # percentage 의 difference
#print(df_abs_diff)
#print(df_pct_diff)
df_pct_diff_avg = df_pct_diff.mean()
xvalues = df_pct_diff_avg.index # x값에 df_pct의 index
yvalues = df_pct_diff_avg.values # y값에 value
fig,axis = plt.subplots(figsize=(10,8))
fig.suptitle("Average Percentage Difference")
color_names = list(mcolors.CSS4_COLORS)
ncolors = len(df_pct_diff_avg)
#print(color_names)
#print(mcolors.CSS4_COLORS)
axis.bar(xvalues,yvalues,
label=df_pct_diff_avg.index, # label
color = color_names[6:ncolors]) # bar color
axis.legend(title='Index')
plt.show()
return None
test3 (log returns)
1
2
3
4
5
6
7
8
9
10
11
12
13
14
15
16
17
18
19
20
21
22
23
24
25
26
27
28
29
30
31
32
33
34
35
36
37
38
39
40
41
42
43
44
45
46
47
48
49
50
51
52
53
54
55
56
57
58
59
60
61
62
63
64
65
66
67
68
69
70
71
72
73
74
75
76
77
78
79
80
81
82
83
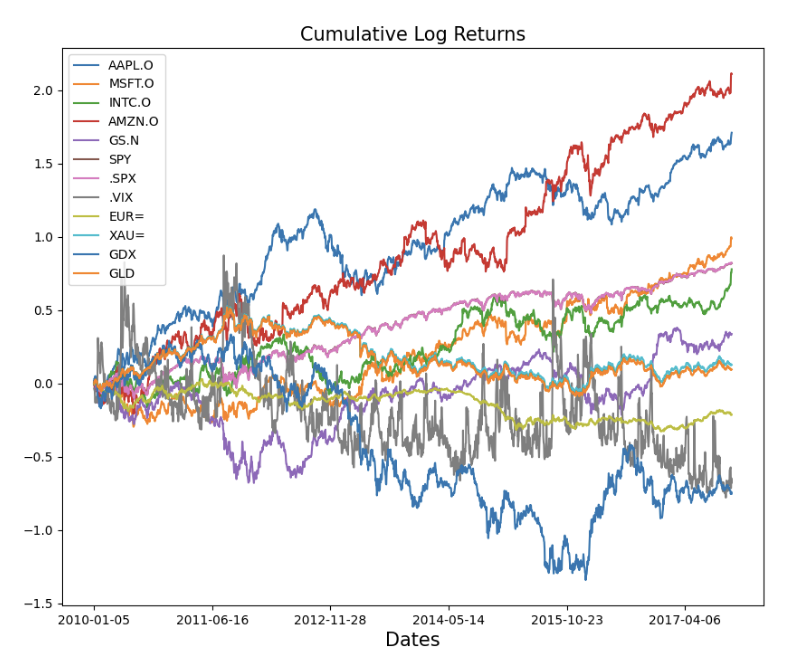
def test_ch8_2():
eikon_path = './tr_eikon_eod_data.csv'
dt_eikon = {
'Date':np.unicode_,
'AAPL.O':np.float64,
'MSFT.O':np.float64,
'INTC.O':np.float64,
'AMZN.O':np.float64,
'GS.N':np.float64,
'SPY':np.float64,
'.SPX':np.float64,
'.VIX':np.float64,
'EUR=':np.float64,
'XAU=':np.float64,
'GDX':np.float64,
'GLD':np.float64
}
df_eikon = pd.read_csv(eikon_path,dtype=dt_eikon,index_col=0)#,parse_dates=True)
# log returns and cumulative sum
df_log_rets = np.log(df_eikon/df_eikon.shift(1)) # p_t/p_t-1 (윗 칸으로 밑에칸을 나눈다)
#위에 칸이 시간상으로 과거, log return을 구하기 위해서
df_cum_log_rets = df_log_rets.cumsum()
#print(df_cum_log_rets)
#ploting
fig,axis = plt.subplots(figsize=(10,8))
xvalues = df_cum_log_rets.dropna().index
attributes = df_cum_log_rets.columns # attribute[0] = "AAPL.0" => 'GLD'
#print(xvalues,attributes)
axis.set_title("Cumulative Log Returns",fontsize=15)
axis.set_xlabel("Dates",fontsize=15)
axis.xaxis.set_major_locator(dates.YearLocator())
for attribute in attributes:
yvalues = df_cum_log_rets[attribute].dropna().values
axis.plot(xvalues,yvalues,label=attribute)
axis.legend()
#plt.reParams["axes.unicode_minus"] = False
plt.show()
return None
test4 (Rolling Statistics)
1
2
3
4
5
6
7
8
9
10
11
12
13
14
15
16
17
18
19
20
21
22
23
24
25
26
27
28
29
30
31
32
33
34
35
36
37
38
39
40
41
42
43
44
45
46
47
48
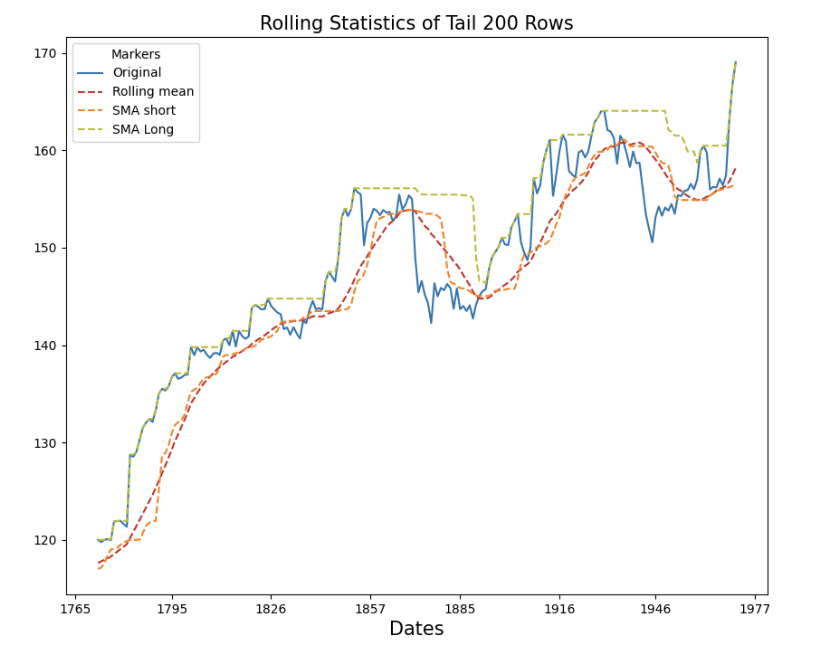
def rol_statics1():
eikon_path = './tr_eikon_eod_data.csv'
dt_eikon = {
'Date':np.object_,
'AAPL.O':np.float64,
'MSFT.O':np.float64,
'INTC.O':np.float64,
'AMZN.O':np.float64,
'GS.N':np.float64,
'SPY':np.float64,
'.SPX':np.float64,
'.VIX':np.float64,
'EUR=':np.float64,
'XAU=':np.float64,
'GDX':np.float64,
'GLD':np.float64
}
df_eikon = pd.read_csv(eikon_path,dtype=dt_eikon)#,parse_dates=True)
attributes = df_eikon.columns
wsize = 20
apple = attributes[1]
#df_apple = df_eikon.loc[apple]#.dropna()
df_eikon['mean'] = df_eikon[apple].rolling(window=wsize).mean()
df_eikon["median"] = df_eikon[apple].rolling(window=wsize).median()
df_eikon["max"] = df_eikon[apple].rolling(window=wsize).max()
fig,axis = plt.subplots(figsize=(10,8))
axis.set_title('Rolling Statistics of Tail 200 Rows',fontsize=15)
axis.set_xlabel('Dates',fontsize=15)
xvalues = df_eikon.index
axis.xaxis.set_major_locator(dates.MonthLocator())
yvalues = df_eikon[apple].values
axis.plot(xvalues[-200:],yvalues[-200:],label="Original")
yvalues = df_eikon['mean'].values
axis.plot(xvalues[-200:],yvalues[-200:],'tab:red',linestyle="dashed",label="Rolling mean")
yvalues = df_eikon["median"].values
axis.plot(xvalues[-200:],yvalues[-200:],"tab:orange",linestyle="dashed",label = "SMA short")
yvalues = df_eikon['max'].values
axis.plot(xvalues[-200:],yvalues[-200:],"tab:olive",linestyle="dashed",label = "SMA Long")
axis.legend(title = "Markers")
plt.show()
return None
test5
1
2
3
4
5
6
7
8
9
10
11
12
13
14
15
16
17
18
19
20
21
22
23
24
25
26
27
28
29
30
31
32
33
34
35
36
37
38
39
40
41
42
43
44
45
46
47
48
49
50
51
52
53
54
55
56
57
58
59
60
61
62
63
64
65
def rol_statics2():
eikon_path = './tr_eikon_eod_data.csv'
dt_eikon = {
'Date':np.object_,
'AAPL.O':np.float64,
'MSFT.O':np.float64,
'INTC.O':np.float64,
'AMZN.O':np.float64,
'GS.N':np.float64,
'SPY':np.float64,
'.SPX':np.float64,
'.VIX':np.float64,
'EUR=':np.float64,
'XAU=':np.float64,
'GDX':np.float64,
'GLD':np.float64
}
df_eikon = pd.read_csv(eikon_path,dtype=dt_eikon)#,parse_dates=True)
#print(df_eikon)
apple = 'AAPL.O'
df_eikon['SMA.short'] = df_eikon[apple].rolling(window=42).mean()
df_eikon["SMA.long"] = df_eikon[apple].rolling(window=252).mean()
fig,axis = plt.subplots(figsize=(10,8))
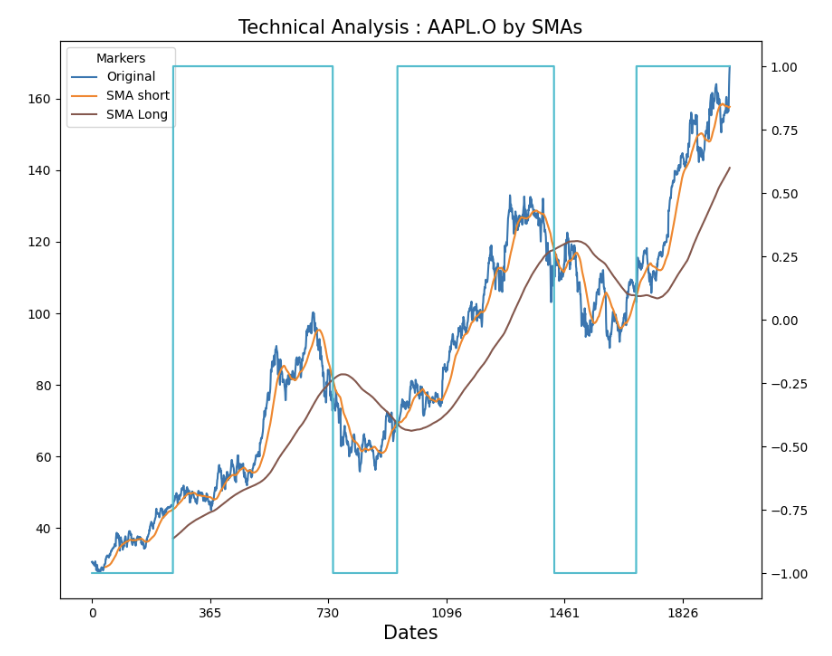
axis.set_title('Technical Analysis : AAPL.O by SMAs',fontsize=15)
axis.set_xlabel('Dates',fontsize=15)
xvalues = df_eikon.index
axis.xaxis.set_major_locator(dates.YearLocator())
yvalues = df_eikon[apple].values
axis.plot(xvalues,yvalues,'tab:blue',label="Original")
yvalues = df_eikon["SMA.short"].values
axis.plot(xvalues,yvalues,"tab:orange",label = "SMA short")
yvalues = df_eikon['SMA.long'].values
axis.plot(xvalues,yvalues,"tab:brown",label = "SMA Long")
axis.legend(title = "Markers")
df_eikon['positions'] = np.where(df_eikon['SMA.short']>df_eikon['SMA.long'],1,-1)
axis2 = axis.twinx() #another y axis
yvalues = df_eikon['positions'].values
axis2.plot(xvalues,yvalues,"tab:cyan")
#plt.rcParams["axes.unicode_minus"] = False # 우측에 마이너스 나타나면서 깨질 경우
plt.show()
print(df_eikon)
return None
def main():
#finance1()
#finance2()
#test_ch8_2()
#rol_statics1()
rol_statics2()
return None
if __name__ == '__main__':
main()
np.where 사용하여 short이 클때는 1 아닐때는 -1 의 내용을 가진 열을 하나 더 만들고, 새로운 y축 axis2를 만들어서 하늘색 선을 그린다.
This post is licensed under CC BY 4.0 by the author.